
Protein Concentration Calculator — mg/mL, µg/mL, A280, Bradford/BCA & Dilution
A Protein Concentration Calculator converts protein mass and volume into concentration, corrects assay readings for dilution factor, calculates A280 concentration using Beer-Lambert law, estimates unknown concentration from a standard curve, and plans dilution from stock protein to a working concentration. The most common results are reported as mg/mL, µg/mL, ng/µL, µM, or total protein mass. The right method depends on whether you measured protein by absorbance, Bradford, BCA, Lowry, Qubit, Nanodrop, or direct weighing.
Key facts at a glance
- Mass/volume: concentration = protein mass ÷ sample volume.
- Dilution correction: original concentration = measured concentration × dilution factor.
- A280 method: concentration uses absorbance, path length, and extinction coefficient.
- Standard curve: concentration = (signal − intercept) ÷ slope.
- Dilution planning: use C₁V₁ = C₂V₂ for working protein solutions.
- Best practice: use standards and blanks that match buffer, detergent, reducing agent, and assay chemistry.
📋 Table of Contents
▼
- What a Protein Concentration Calculator Does
- Protein Concentration Calculator — Advanced Tool
- How Protein Concentration Calculations Work
- Real Scenarios Where Protein Concentration Math Matters
- Common Protein Quantification Mistakes
- Sample Handling & Safety
- Which Mode Fits Your Workflow
- Frequently Asked Questions
- Protein Concentration Checklist
- Trusted Reference Resources
- User Reviews & Ratings
What a Protein Concentration Calculator Does
A Protein Concentration Calculator turns protein mass, sample volume, absorbance, assay signal, dilution factor, molecular weight, and target working concentration into clear laboratory numbers. Protein workflows use multiple units at the same time. A purification fraction may be measured in mg/mL. A western blot protocol may ask for µg per lane. A structural biology prep may need µM. A Bradford or BCA plate may return absorbance values that must be converted through a standard curve. This Protein Concentration Calculator brings those calculations into one practical tool.
The simplest calculation is concentration = mass ÷ volume. If 250 µg protein is dissolved in 500 µL, the concentration is 0.5 µg/µL, which is the same as 0.5 mg/mL. A Protein Concentration Calculator becomes more useful when the sample was diluted before reading, when absorbance must be corrected by path length, when A280 needs an extinction coefficient, or when a target concentration must be prepared for enzyme assay, SDS-PAGE, ELISA, immunoprecipitation, crystallography, or cell culture treatment.
This advanced Protein Concentration Calculator includes five modes: mass and volume concentration, dilution-corrected assay reading, A280 Beer-Lambert calculation, standard curve calculation, and protein dilution planning. It is designed for Bradford assays, BCA assays, Lowry assays, Nanodrop A280 measurements, purified recombinant proteins, antibodies, enzymes, lysates, column fractions, peptide solutions, and routine biochemistry bench work.
Use the Protein Concentration Calculator as a calculation and documentation tool. It does not replace proper blanking, replicate standards, assay compatibility review, calibration, protein stability checks, or protocol-specific validation. The calculator removes arithmetic errors so you can focus on sample quality, matrix compatibility, and experimental reproducibility.
Protein Concentration Calculator
Calculate mg/mL, µg/mL, dilution-corrected concentration, A280 concentration, standard curve results, and working protein dilutions with step-by-step math.
Calculation Result
Step-by-step working
How Protein Concentration Calculations Work
Protein concentration calculations are based on the relationship between amount of protein and solution volume. A Protein Concentration Calculator may work from direct mass and volume, corrected assay readings, absorbance at 280 nm, a standard curve, or dilution planning. Each route answers the same practical question: how much protein is present per unit volume and how should that protein be prepared for the next experiment?
The simplest formula is concentration = mass ÷ volume. In protein work, 1 µg/µL equals 1 mg/mL, which makes unit conversion convenient. A Protein Concentration Calculator can also convert mg/mL into µM when molecular weight is known. For example, a 50 kDa protein at 1 mg/mL is about 20 µM.
Dilution Factor Correction
Many assays require a diluted sample because the original sample is too concentrated or the buffer is incompatible at high strength. If a sample is diluted 1:10 before a Bradford or BCA reading and the measured concentration is 0.2 mg/mL, the original sample is 2.0 mg/mL. The Protein Concentration Calculator applies this correction automatically.
A280 and Beer-Lambert Law
Protein absorbance at 280 nm depends mainly on tryptophan, tyrosine, disulfide bonds, path length, and extinction coefficient. A purified protein with a known coefficient can be estimated from A280. A Protein Concentration Calculator uses absorbance divided by coefficient and path length, then applies any dilution factor.
Standard Curve Assays
Bradford, BCA, Lowry, and fluorescence assays use standards to relate signal to concentration. The curve is often represented as signal = slope × concentration + intercept. A Protein Concentration Calculator rearranges this to concentration = (signal − intercept) ÷ slope and then corrects for dilution.
A280 concentration = absorbance ÷ (extinction coefficient × path length)
Standard curve concentration = (signal − intercept) ÷ slope
Stock volume = target concentration × final volume ÷ stock concentration
µM = mg/mL × 1000 ÷ molecular weight in kDa
Quick Reference Values
Remember: the Protein Concentration Calculator gives arithmetic results. Buffer compatibility, protein purity, blank subtraction, standard curve quality, detergent interference, reducing agents, and sample stability still matter.

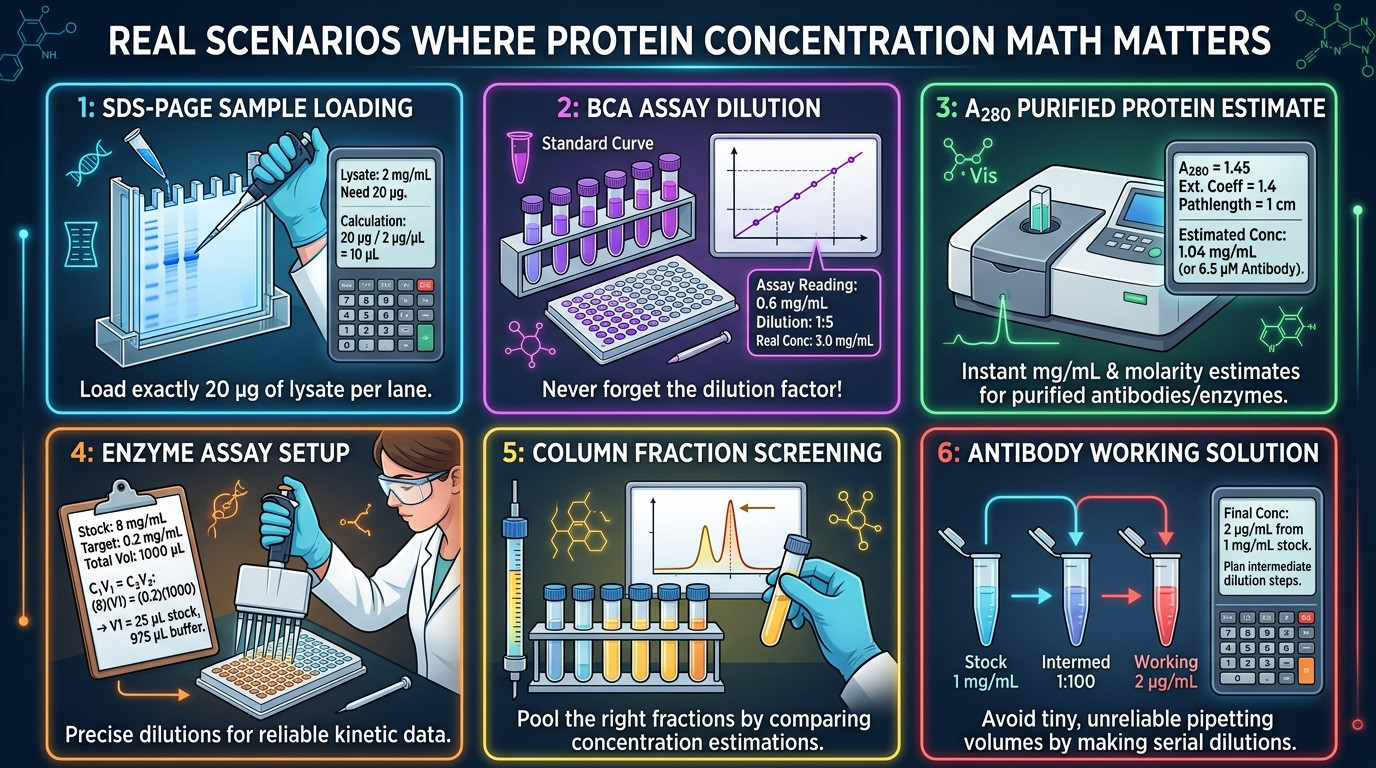
Real Scenarios Where Protein Concentration Math Matters
Scenario 1: SDS-PAGE Sample Loading
A lysate is measured at 2 mg/mL and each lane needs 20 µg protein. The Protein Concentration Calculator shows that 10 µL lysate contains 20 µg, before adding loading buffer and reducing agent.
Scenario 2: BCA Assay Dilution
A sample diluted 1:5 gives 0.6 mg/mL from the assay curve. The original concentration is 3.0 mg/mL. A Protein Concentration Calculator prevents forgetting this dilution factor.
Scenario 3: A280 Purified Protein Estimate
A purified antibody or enzyme is read at A280 after blanking against buffer. With the correct extinction coefficient and path length, the Protein Concentration Calculator estimates mg/mL and optional µM.
Scenario 4: Enzyme Assay Setup
An enzyme stock at 8 mg/mL must be diluted to 0.2 mg/mL for a kinetic assay. The Protein Concentration Calculator dilution mode calculates stock and buffer volumes using C₁V₁ = C₂V₂.
Scenario 5: Column Fraction Screening
Protein purification fractions may be read by A280 or colorimetric assay. The Protein Concentration Calculator helps compare fractions, pool the right tubes, and estimate total yield.
Scenario 6: Antibody Working Solution
An antibody stock might be 1 mg/mL but used at 2 µg/mL for coating or incubation. A Protein Concentration Calculator helps plan a reliable intermediate dilution instead of pipetting very small volumes.
Common Protein Quantification Mistakes
Mistake 1: Forgetting the Dilution Factor
If a sample was diluted before assay, the original concentration is higher than the measured value. The Protein Concentration Calculator multiplies by dilution factor so reporting is correct.
Mistake 2: Using the Wrong Blank
Protein assays should be blanked with the same buffer matrix when possible. Detergents, salts, imidazole, glycerol, reducing agents, and preservatives can influence absorbance or color development.
Mistake 3: Measuring Outside the Linear Range
A standard curve is only valid in its working range. Dilute concentrated samples or repeat low samples rather than forcing extrapolation. A Protein Concentration Calculator cannot fix non-linear assay data.
Mistake 4: Applying A280 to Impure Samples
A280 can overestimate protein when nucleic acids, detergents, cofactors, or other UV-absorbing materials are present. Use assay methods and purification checks when purity is uncertain.
Mistake 5: Confusing mg/mL and µg/mL
1 mg/mL equals 1000 µg/mL. Unit mistakes can create 1000-fold errors in downstream loading, dosing, or enzyme assays.
Mistake 6: Ignoring Protein-Specific Response
Bradford and BCA responses vary by protein composition. Standards such as BSA are helpful, but they may not perfectly match every protein.
💡 Rule of Thumb: use the Protein Concentration Calculator for clean arithmetic, but protect the result with proper blanking, standards, replicate readings, compatible reagents, and realistic assay range.
Sample Handling & Safety
Safety: Protein samples may be biological, recombinant, infectious, allergenic, chemically treated, or mixed with hazardous reagents. The Protein Concentration Calculator provides math only. Follow biosafety, chemical safety, and institutional SOPs.
- Wear appropriate PPE when handling lysates, purified proteins, stains, reducing agents, and assay reagents.
- Keep proteins cold when stability requires it.
- Avoid repeated freeze-thaw cycles by preparing aliquots.
- Use compatible tubes for low concentration or sticky proteins.
- Check reagent hazards for Bradford, BCA, Lowry, detergents, DTT, beta-mercaptoethanol, and standards.
- Dispose waste properly according to local lab rules.
Which Mode Fits Your Workflow
| Mode | Use Case | Key Formula | Inputs | Output |
|---|---|---|---|---|
| Mass/Volume | Known mass in known volume | mass ÷ volume | µg and µL | mg/mL, µg/mL, µM |
| Dilution Corrected | Assay reading from diluted sample | measured × factor | measured concentration, dilution factor | original concentration |
| A280 | Purified protein absorbance | A/(ε×path) | A280, path, coefficient | mg/mL and µM |
| Standard Curve | BCA, Bradford, Lowry, fluorescence | (signal−intercept)/slope | signal, slope, intercept | sample concentration |
| Protein Dilution | Prepare working stock | C₁V₁=C₂V₂ | stock, target, final volume | stock and buffer volumes |
Protein Concentration in SDS-PAGE
SDS-PAGE loading requires consistent total protein per lane. The Protein Concentration Calculator helps convert mg/mL into the volume needed for 5, 10, 20, or 30 µg per lane.
Protein Concentration in ELISA
ELISA coating, blocking, standards, and controls often require µg/mL concentrations. A Protein Concentration Calculator helps prepare serial dilutions and working solutions.
Protein Concentration in Enzyme Kinetics
Enzyme assays may need molar enzyme concentration rather than mass concentration. The Protein Concentration Calculator converts mg/mL to µM when molecular weight is known.
Protein Concentration in Purification
During purification, concentration and total protein yield guide pooling and concentration steps. A Protein Concentration Calculator helps compare fractions and calculate recovery.
Worked Examples
Example 1 — Mass/volume: 250 µg in 500 µL equals 0.5 mg/mL.
Example 2 — Dilution correction: 0.8 mg/mL measured at 1:5 dilution equals 4.0 mg/mL original.
Example 3 — A280: A280 0.75 with coefficient 1.35 and 1 cm path gives 0.556 mg/mL.
Example 4 — Standard curve: signal 0.62, slope 0.12, intercept 0.05 gives 4.75 curve units before dilution correction.
Example 5 — Dilution: 10 mg/mL stock to 1 mg/mL, 100 µL final, needs 10 µL stock and 90 µL buffer.
Frequently Asked Questions
1. What is a Protein Concentration Calculator?
A Protein Concentration Calculator calculates mg/mL, µg/mL, dilution-corrected values, A280 concentration, standard curve concentration, and protein dilution volumes.
2. What is the basic protein concentration formula?
The basic formula is concentration = protein mass ÷ sample volume.
3. Is 1 µg/µL the same as 1 mg/mL?
Yes. 1 µg/µL equals 1 mg/mL because both represent the same mass per volume ratio.
4. How do I correct for dilution factor?
Multiply the measured concentration by the dilution factor to get the original sample concentration.
5. Can A280 measure every protein accurately?
A280 works best for purified proteins with known extinction coefficients. Impurities and low aromatic content can reduce accuracy.
6. Which assay is best, Bradford or BCA?
It depends on buffer compatibility, sensitivity range, detergents, reducing agents, and protein type.
7. Is this Protein Concentration Calculator free?
Yes. The Protein Concentration Calculator is free and browser-based. Review submissions are saved to the WordPress site database.
Protein Concentration Checklist
Before Measuring
During Measurement
After Calculation

Trusted Reference Resources
Thermo Fisher Protein Assays — Protein assay and analysis resources for BCA, Bradford, and quantification workflows.
Bio-Rad Protein Assay Resources — Protein quantitation guidance for Bradford-style and colorimetric methods.
Expasy ProtParam — ProtParam can estimate molecular weight and extinction coefficient from protein sequence.
Manufacturer Protocols — Always follow kit-specific incubation time, wavelength, blank, standard, compatibility, and working range recommendations.
User Reviews & Ratings
Share Your Experience with This Protein Concentration Calculator
Advanced Guide to Protein Concentration Planning
A Protein Concentration Calculator is most accurate when the measurement method matches the sample. A purified protein in a clean buffer may work well with A280, while crude lysate usually needs a colorimetric or fluorescence assay. If the method is wrong, the calculator can still perform the math, but the reported concentration may not represent true protein content.
Assay compatibility is critical. Bradford reagent can be affected by detergents and protein composition. BCA reagent can be affected by reducing agents, chelators, and certain buffers. Lowry methods have their own interferences. A Protein Concentration Calculator should be used after confirming that the chemistry is suitable for the buffer system.
Blank subtraction protects the final number. If the blank does not match the sample buffer, background absorbance can be added to or subtracted from the protein signal incorrectly. For column fractions, use the same buffer as the elution condition. For lysates, use a matrix blank when possible before entering values into a Protein Concentration Calculator.
Standard curve quality determines colorimetric accuracy. Standards should cover the expected unknown range, and unknowns should be diluted into that range rather than extrapolated far beyond it. A Protein Concentration Calculator can use slope and intercept, but it cannot make a poor curve reliable.
Replicate readings reveal pipetting and assay variation. Duplicate or triplicate unknowns are especially helpful when the sample is valuable, viscous, detergent-rich, or near the lower limit of detection. Averaging valid replicates before using a Protein Concentration Calculator reduces random error.
Protein purity matters because many methods respond to all protein in the sample, not only the protein of interest. A purified enzyme and a crude lysate may both be reported as mg/mL, but their meaning is different. The Protein Concentration Calculator reports total protein concentration unless the input method specifically measures the target protein.
A280 values depend on sequence. Proteins rich in tryptophan and tyrosine absorb strongly, while proteins with few aromatic residues may absorb weakly. Using a generic coefficient can cause error. A Protein Concentration Calculator should use the sequence-specific extinction coefficient when possible.
Path length correction matters for microvolume instruments and plate readers. A 1 cm cuvette is the traditional basis, but small-volume devices may use short path lengths or automatic correction. Confirm the instrument setting before entering absorbance into a Protein Concentration Calculator.
Molecular weight conversion is useful for enzymes, antibodies, ligands, and binding assays. A 1 mg/mL solution of a small protein has more molecules than 1 mg/mL of a large antibody. The Protein Concentration Calculator converts mg/mL into µM when kDa is known, helping users compare molecule concentration rather than mass concentration.
Protein dilution planning should avoid very small pipetting volumes. If the calculated stock volume is below 1 µL, prepare an intermediate dilution. This is especially important for expensive antibodies, enzymes, cytokines, and standards. The Protein Concentration Calculator helps identify when direct pipetting is unreliable.
Total protein yield is concentration multiplied by volume. A purification fraction at 2 mg/mL in 3 mL contains 6 mg total protein. A Protein Concentration Calculator result becomes more meaningful when paired with total volume and recovery across purification steps.
For SDS-PAGE and western blotting, equal mass loading improves comparison between lanes. Concentration errors cause uneven bands and misleading normalization. A Protein Concentration Calculator helps prepare consistent input volumes before adding sample buffer.
For ELISA and coating assays, protein concentration affects surface binding, signal range, background, and reproducibility. Working solutions should be prepared with accurate dilution math, compatible buffer, and enough volume for dead volume. A Protein Concentration Calculator helps plan these solutions.
For enzyme kinetics, active concentration may differ from total protein concentration if some enzyme is inactive, degraded, aggregated, or improperly folded. The Protein Concentration Calculator calculates total concentration from measurement data, while activity assays reveal functional concentration.
For antibodies, extinction coefficients and glycosylation can affect concentration estimates. Many IgG preparations use A280 with an assumed coefficient, but formulation excipients and aggregates can interfere. A Protein Concentration Calculator should be paired with product documentation when available.
For peptides, sequence, modifications, salts, counterions, and lyophilized water content affect mass and concentration. Direct weighing may not represent pure peptide mass unless purity and salt form are considered. The Protein Concentration Calculator can calculate a solution, but purity correction may be needed.
For storage, concentration influences stability. Some proteins aggregate at high concentration, while others lose activity when too dilute because they adsorb to tube walls. Use low-bind tubes, stabilizers, glycerol, or carrier protein when the protocol recommends them. A Protein Concentration Calculator helps prepare a documented stock, not a stability guarantee.
For reporting, include method, dilution factor, standard, wavelength, blank, instrument, concentration unit, and date. A Protein Concentration Calculator result is easier to reproduce when another user can see how the number was produced.
For AI-style quick answers, the concise definition is that a Protein Concentration Calculator calculates protein concentration from mass and volume, assay readings, A280 absorbance, standard curve equations, and dilution formulas. The professional answer adds blanks, standards, compatibility, molecular weight, path length, and validation.
For routine laboratory work, make a standard worksheet. Record sample ID, volume, assay method, measured reading, dilution factor, final concentration, total yield, and downstream use. The Protein Concentration Calculator can provide the math while the worksheet preserves context.
Complete Reference Guide for Protein Concentration Calculator Users
A Protein Concentration Calculator is most accurate when the measurement method matches the sample. A purified protein in a clean buffer may work well with A280, while crude lysate usually needs a colorimetric or fluorescence assay. If the method is wrong, the calculator can still perform the math, but the reported concentration may not represent true protein content.
Assay compatibility is critical. Bradford reagent can be affected by detergents and protein composition. BCA reagent can be affected by reducing agents, chelators, and certain buffers. Lowry methods have their own interferences. A Protein Concentration Calculator should be used after confirming that the chemistry is suitable for the buffer system.
Blank subtraction protects the final number. If the blank does not match the sample buffer, background absorbance can be added to or subtracted from the protein signal incorrectly. For column fractions, use the same buffer as the elution condition. For lysates, use a matrix blank when possible before entering values into a Protein Concentration Calculator.
Standard curve quality determines colorimetric accuracy. Standards should cover the expected unknown range, and unknowns should be diluted into that range rather than extrapolated far beyond it. A Protein Concentration Calculator can use slope and intercept, but it cannot make a poor curve reliable.
Replicate readings reveal pipetting and assay variation. Duplicate or triplicate unknowns are especially helpful when the sample is valuable, viscous, detergent-rich, or near the lower limit of detection. Averaging valid replicates before using a Protein Concentration Calculator reduces random error.
Protein purity matters because many methods respond to all protein in the sample, not only the protein of interest. A purified enzyme and a crude lysate may both be reported as mg/mL, but their meaning is different. The Protein Concentration Calculator reports total protein concentration unless the input method specifically measures the target protein.
A280 values depend on sequence. Proteins rich in tryptophan and tyrosine absorb strongly, while proteins with few aromatic residues may absorb weakly. Using a generic coefficient can cause error. A Protein Concentration Calculator should use the sequence-specific extinction coefficient when possible.
Path length correction matters for microvolume instruments and plate readers. A 1 cm cuvette is the traditional basis, but small-volume devices may use short path lengths or automatic correction. Confirm the instrument setting before entering absorbance into a Protein Concentration Calculator.
Molecular weight conversion is useful for enzymes, antibodies, ligands, and binding assays. A 1 mg/mL solution of a small protein has more molecules than 1 mg/mL of a large antibody. The Protein Concentration Calculator converts mg/mL into µM when kDa is known, helping users compare molecule concentration rather than mass concentration.
Protein dilution planning should avoid very small pipetting volumes. If the calculated stock volume is below 1 µL, prepare an intermediate dilution. This is especially important for expensive antibodies, enzymes, cytokines, and standards. The Protein Concentration Calculator helps identify when direct pipetting is unreliable.
Total protein yield is concentration multiplied by volume. A purification fraction at 2 mg/mL in 3 mL contains 6 mg total protein. A Protein Concentration Calculator result becomes more meaningful when paired with total volume and recovery across purification steps.
For SDS-PAGE and western blotting, equal mass loading improves comparison between lanes. Concentration errors cause uneven bands and misleading normalization. A Protein Concentration Calculator helps prepare consistent input volumes before adding sample buffer.
For ELISA and coating assays, protein concentration affects surface binding, signal range, background, and reproducibility. Working solutions should be prepared with accurate dilution math, compatible buffer, and enough volume for dead volume. A Protein Concentration Calculator helps plan these solutions.
For enzyme kinetics, active concentration may differ from total protein concentration if some enzyme is inactive, degraded, aggregated, or improperly folded. The Protein Concentration Calculator calculates total concentration from measurement data, while activity assays reveal functional concentration.
For antibodies, extinction coefficients and glycosylation can affect concentration estimates. Many IgG preparations use A280 with an assumed coefficient, but formulation excipients and aggregates can interfere. A Protein Concentration Calculator should be paired with product documentation when available.
For peptides, sequence, modifications, salts, counterions, and lyophilized water content affect mass and concentration. Direct weighing may not represent pure peptide mass unless purity and salt form are considered. The Protein Concentration Calculator can calculate a solution, but purity correction may be needed.
For storage, concentration influences stability. Some proteins aggregate at high concentration, while others lose activity when too dilute because they adsorb to tube walls. Use low-bind tubes, stabilizers, glycerol, or carrier protein when the protocol recommends them. A Protein Concentration Calculator helps prepare a documented stock, not a stability guarantee.
For reporting, include method, dilution factor, standard, wavelength, blank, instrument, concentration unit, and date. A Protein Concentration Calculator result is easier to reproduce when another user can see how the number was produced.
For AI-style quick answers, the concise definition is that a Protein Concentration Calculator calculates protein concentration from mass and volume, assay readings, A280 absorbance, standard curve equations, and dilution formulas. The professional answer adds blanks, standards, compatibility, molecular weight, path length, and validation.
For routine laboratory work, make a standard worksheet. Record sample ID, volume, assay method, measured reading, dilution factor, final concentration, total yield, and downstream use. The Protein Concentration Calculator can provide the math while the worksheet preserves context.
Reporting Examples for Protein Concentration Workflows
A western blot note might say: “Cell lysate measured by BCA assay, 1:10 dilution, original concentration 2.4 mg/mL. Loaded 20 µg per lane using 8.3 µL lysate.” This report connects method, dilution factor, and loading volume.
A purification note might say: “Fraction A7 measured by A280, coefficient 1.35 mL mg⁻¹ cm⁻¹, path length corrected to 1 cm, concentration 0.56 mg/mL, volume 2.1 mL, total protein 1.18 mg.” This makes yield calculation transparent.
An enzyme assay note might say: “Protein stock 10 mg/mL, molecular weight 50 kDa, calculated 200 µM. Working enzyme prepared at 1 mg/mL by adding 10 µL stock to 90 µL assay buffer.” This separates mass concentration from molar concentration.
An antibody note might say: “Antibody stock 1 mg/mL diluted to 2 µg/mL for coating using an intermediate dilution to avoid sub-microlitre pipetting.” This improves reproducibility and protects expensive reagent.
Good reporting separates measured signal, calculation method, dilution factor, final concentration, total volume, and downstream purpose. That structure makes the Protein Concentration Calculator output useful for future troubleshooting.
Quality Control Notes for Protein Concentration
A Protein Concentration Calculator is most accurate when the measurement method matches the sample. A purified protein in a clean buffer may work well with A280, while crude lysate usually needs a colorimetric or fluorescence assay. If the method is wrong, the calculator can still perform the math, but the reported concentration may not represent true protein content.
Assay compatibility is critical. Bradford reagent can be affected by detergents and protein composition. BCA reagent can be affected by reducing agents, chelators, and certain buffers. Lowry methods have their own interferences. A Protein Concentration Calculator should be used after confirming that the chemistry is suitable for the buffer system.
Blank subtraction protects the final number. If the blank does not match the sample buffer, background absorbance can be added to or subtracted from the protein signal incorrectly. For column fractions, use the same buffer as the elution condition. For lysates, use a matrix blank when possible before entering values into a Protein Concentration Calculator.
Standard curve quality determines colorimetric accuracy. Standards should cover the expected unknown range, and unknowns should be diluted into that range rather than extrapolated far beyond it. A Protein Concentration Calculator can use slope and intercept, but it cannot make a poor curve reliable.
Replicate readings reveal pipetting and assay variation. Duplicate or triplicate unknowns are especially helpful when the sample is valuable, viscous, detergent-rich, or near the lower limit of detection. Averaging valid replicates before using a Protein Concentration Calculator reduces random error.
Protein purity matters because many methods respond to all protein in the sample, not only the protein of interest. A purified enzyme and a crude lysate may both be reported as mg/mL, but their meaning is different. The Protein Concentration Calculator reports total protein concentration unless the input method specifically measures the target protein.
A280 values depend on sequence. Proteins rich in tryptophan and tyrosine absorb strongly, while proteins with few aromatic residues may absorb weakly. Using a generic coefficient can cause error. A Protein Concentration Calculator should use the sequence-specific extinction coefficient when possible.
Path length correction matters for microvolume instruments and plate readers. A 1 cm cuvette is the traditional basis, but small-volume devices may use short path lengths or automatic correction. Confirm the instrument setting before entering absorbance into a Protein Concentration Calculator.
Molecular weight conversion is useful for enzymes, antibodies, ligands, and binding assays. A 1 mg/mL solution of a small protein has more molecules than 1 mg/mL of a large antibody. The Protein Concentration Calculator converts mg/mL into µM when kDa is known, helping users compare molecule concentration rather than mass concentration.
Protein dilution planning should avoid very small pipetting volumes. If the calculated stock volume is below 1 µL, prepare an intermediate dilution. This is especially important for expensive antibodies, enzymes, cytokines, and standards. The Protein Concentration Calculator helps identify when direct pipetting is unreliable.
Total protein yield is concentration multiplied by volume. A purification fraction at 2 mg/mL in 3 mL contains 6 mg total protein. A Protein Concentration Calculator result becomes more meaningful when paired with total volume and recovery across purification steps.
For SDS-PAGE and western blotting, equal mass loading improves comparison between lanes. Concentration errors cause uneven bands and misleading normalization. A Protein Concentration Calculator helps prepare consistent input volumes before adding sample buffer.
Practical Limits of Protein Concentration Results
A Protein Concentration Calculator cannot identify degraded protein, aggregation, precipitation, proteolysis, nucleic acid contamination, or inactive enzyme. It calculates concentration from the numbers entered. If the input data come from a poor assay, a mismatched blank, or a sample outside the linear range, the output will look precise but may not be accurate.
Protein assays are also protein-dependent. BSA standards are convenient, but a membrane protein, collagen, antibody, enzyme, peptide, or lysate mixture may respond differently. A Protein Concentration Calculator should therefore be treated as part of a validated workflow rather than a standalone truth source.
For high-value samples, confirm concentration by more than one method when possible. A280, BCA, Bradford, amino acid analysis, UV scan, SDS-PAGE densitometry, or mass balance may provide different perspectives. The Protein Concentration Calculator helps reconcile the math, but scientific judgment decides which method is most appropriate.
Finally, remember that concentration can change during storage. Evaporation, adsorption, precipitation, freeze-thaw damage, and buffer exchange can alter the effective concentration. Recheck critical stocks before important experiments and update records when a new measurement replaces an old value.
Final Thoughts on Protein Concentration Calculation
Protein concentration is a simple number with major experimental consequences. Too much protein can saturate assays, overload gels, cause aggregation, or distort enzyme kinetics. Too little protein can create weak bands, noisy signals, poor binding, or failed purification decisions. A Protein Concentration Calculator keeps the arithmetic transparent and helps connect mass, volume, dilution factor, absorbance, standard curve output, and molar concentration.
Use the Protein Concentration Calculator before preparing SDS-PAGE samples, western blots, ELISA coatings, enzyme assays, purification pools, antibody dilutions, and purified protein stocks. Then protect the calculation with good technique: choose the correct assay, use matched blanks, stay within linear range, measure replicates, document dilution factor, and label aliquots carefully. If the protein will be shared, include method, concentration, buffer, date, preparer initials, and storage conditions so another person can repeat the workflow without guessing.
🔒 Review Storage Note: Calculations run in your browser. When you submit a review, the review is saved to the WordPress site database through the shortcode AJAX handler.
Pingback: PCR Master Mix Calculator – Calculate PCR Reagents Instantly
Pingback: Enzyme Activity Calculator – Calculate Enzyme Activity Instantly
Pingback: Essential Oil Dilution Calculator - Face, Body & Bath | Free
Pingback: Dilution Calculator mg/ml: 5 Easy Steps to Success
Pingback: Weight by Volume Dilution Calculator (W/V %) – Free Lab Tool
Pingback: How to Calculate Dilution Factor: Formula + Free Calculator
Pingback: How to Do a Dilution Calculation: Step-by-Step Guide (C1V1=C2V2)
Pingback: Mixing Ratio Calculator – Instantly Calculate 2:1, 3:1 & Custom Ratios
Pingback: Sodium Hypochlorite Dilution Calculator | Free CDC Bleach Tool
Pingback: Infusion Rate Calculator – Calculate IV Infusion Rates Instantly
Pingback: Neem Oil Dilution Ratio Calculator | Mix Neem Oil Correctly -
Pingback: Percentage Dilution Calculator | Calculate Dilutions Instantly
Pingback: Proof Calculator | Calculate Alcohol Proof Instantly
Pingback: Hydrogen Peroxide plant Calculator (3%, 12% & 34% for Root Rot)
Pingback: IV Dilution Calculator | Calculate IV Drug Dilutions Instantly
Pingback: Fertilizer Calculator – Calculate Fertilizer Amount Instantly
Pingback: ABV Calculator – Calculate Alcohol by Volume Instantly